11.2 North America: Who Gets to Be North American?
Who Gets to Be North American?
A border map makes North America look settled. States fit against states, provinces against provinces, and two enormous countries seem to occupy nearly every available space. But those lines arrived late. Beneath them are Indigenous nations, forced migrations, settlement frontiers, languages, religious landscapes, family networks, and newer migrations that continue to change who lives where. The map is not finished because the people on it are not finished.
By the end of this section, you should be able to:
- Explain why Indigenous nations belong on the contemporary political map of the United States and Canada.
- Describe settler colonialism, slavery, immigration, and internal migration as processes that reorganized land, population, and opportunity.
- Explain how race, language, religion, and national identity become visible in cultural landscapes and institutions.
- Compare the 2025 age structures of the United States and Canada and connect demographic change to migration and population policy.
Indigenous Nations Are Present Tense
A conventional map of the United States and Canada begins with state, provincial, territorial, and international borders. That is already a political choice. Long before either country existed, Indigenous nations organized territory through kinship, diplomacy, trade, agriculture, fishing, hunting, seasonal movement, warfare, and spiritual relationships with land and water.
The Haudenosaunee Confederacy linked nations in the northeast. Anishinaabe peoples lived throughout the Great Lakes region. Dakota and Lakota homelands extended across the northern plains. Pueblo communities built agricultural societies in the southwest. Tlingit, Haida, Coast Salish, Inuit, Inupiat, Cree, Dene, and hundreds of other peoples developed political and ecological systems adapted to particular places.
These peoples did not disappear when settler maps covered their names. Indigenous nations remain governments, communities, treaty partners, land holders, cultural institutions, and political actors.
The United States recognizes 575 tribal entities in government-to-government relationships with the federal government. Canada recognizes First Nations, Inuit, and Métis peoples whose Aboriginal and treaty rights are affirmed in the Constitution Act of 1982. Canada was implementing 27 modern treaties in 2026, while other negotiations over land, resources, rights, and self-government continued.
Reservations and reserves are therefore not simply ethnic neighborhoods. They are fragments of political territory produced through treaties, coercion, removal, legislation, and administrative decisions. Indigenous governments operate schools, courts, housing programs, resource systems, cultural institutions, businesses, and public services under widely differing legal arrangements.

An Old Map Can Preserve Knowledge and Still Distort It
Historical maps become especially interesting when we stop asking whether they are simply right or wrong. A map can contain extraordinary information and still impose the assumptions of the people who made it.
In 1890, John Wesley Powell and the U.S. Bureau of Ethnology published a map classifying Indigenous languages across much of North America. It preserves evidence of extraordinary linguistic diversity. It also turns living peoples and changing territories into categories created by a federal institution. The colors are useful. They are not neutral.
Interactive: Read the 1890 Map Slowly
This is the actual Powell map, not a modern reconstruction. Choose a region to enlarge it. Notice how quickly the simple idea of one Indigenous culture dissolves into many languages and territories.

Settler Colonialism Was a Spatial Project
Settler colonialism seeks not merely to govern Indigenous people but to acquire and permanently occupy Indigenous land. That required more than settlers. It required armies, treaties, surveyors, property law, schools, railroads, migration incentives, and stories that described occupied landscapes as empty or underused.
In the United States, forced removal pushed many nations westward, only for settlers and the federal government to pursue them again. Reservations confined peoples to reduced territories. The Dawes Act divided communally held lands into individual allotments and opened so-called surplus land to non-Indigenous ownership. American Indians controlled roughly 138 million acres before allotment. By 1934, only about 48 million acres remained under tribal control.
Canada reorganized Indigenous space through numbered treaties, reserves, the Indian Act, railroads, resource development, and provincial expansion. Metis communities were pushed from Red River and across the Prairies as settler agriculture and Canadian state power moved west. Inuit communities experienced relocation, settlement policies, residential schooling, and increasing state control throughout the Arctic.

Both countries also removed children from their families in an effort to weaken Indigenous languages and cultural continuity. The United States supported Indian boarding schools from the nineteenth century into the twentieth. Canada's residential school system lasted for more than a century and was described by the Truth and Reconciliation Commission as cultural genocide.
The purpose of studying this history is not to assign personal guilt to students living today. It is to explain the map. Property ownership, agricultural settlement, national parks, mining rights, municipal boundaries, and transportation corridors did not arise on empty land.
Two Settler States, Different National Stories
The United States and Canada often tell their histories in contrasting styles. The United States emphasizes revolution, individual liberty, westward expansion, and a written Constitution. Canada emphasizes gradual independence, parliamentary government, bilingual compromise, public institutions, and a supposedly gentler national character.
There is truth in the contrast. The United States did emerge through revolution and developed a political culture unusually suspicious of centralized government. Canada retained stronger ties to Britain, developed parliamentary federalism, and eventually built national institutions such as universal health care. French-English relations shaped Canada in a way with no exact U.S. equivalent.
Yet both states expanded across Indigenous territories. Both organized race and property through law. Both recruited immigrants while excluding others. Both developed resource frontiers and urban-industrial cores. Both contain regional identities powerful enough to challenge simple national stories.
Slavery, Freedom, and Black Geographies
The forced migration of enslaved Africans was central to the creation of the United States. Plantation agriculture produced cotton, tobacco, rice, sugar, and enormous wealth through violence. Northern merchants, insurers, shippers, banks, and manufacturers also profited from slave-produced commodities. Slavery was geographically concentrated, but its economy was continental and Atlantic.
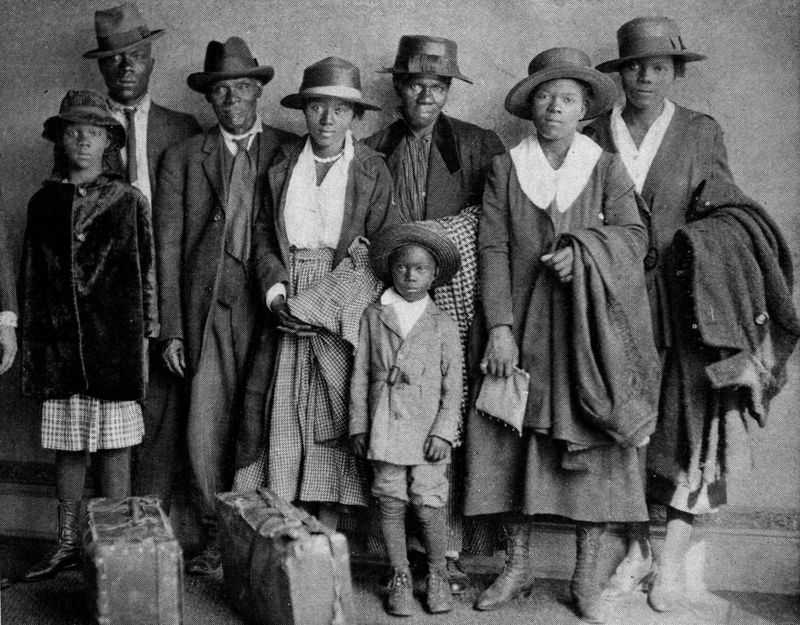
The Civil War ended legal slavery, not racial hierarchy. Reconstruction was followed by segregation, disenfranchisement, racial terror, and unequal access to land, education, credit, and political power. During the twentieth-century Great Migration , millions of Black Americans moved from the South toward cities including Chicago, Detroit, Cleveland, New York, Philadelphia, Los Angeles, Oakland, and Minneapolis.
Movement created opportunity, but movement did not guarantee escape. Housing discrimination, racial violence, lending policy, restrictive covenants, and later highway construction confined or displaced many families. Industrial jobs attracted migrants to northern cities, then deindustrialization removed employment from many of the same landscapes.
Black geography is not only a geography of injury. Churches, newspapers, music, political movements, universities, businesses, festivals, restaurants, and mutual-aid networks turned neighborhoods created partly through exclusion into places of creativity and belonging.
Canada also contains long-established Black communities, including descendants of enslaved people, Black Loyalists, Caribbean migrants, African immigrants, and refugees from the United States. The Underground Railroad occupies an honored place in Canadian memory, but racism did not stop at the border. Black Canadians also faced segregation, employment discrimination, restrictive covenants, and unequal treatment.
Migration Built the Population
North American nations repeatedly describe immigration as a new crisis. Historically, migration is closer to a permanent condition.
European settlement was migration tied to conquest and colonial expansion. Africans arrived through forced migration. Chinese workers helped construct western railroads and mining economies before exclusion laws attempted to shut them out. Irish, Italian, Jewish, Scandinavian, German, Polish, Ukrainian, and other migrants entered industrial cities and agricultural frontiers. Mexican workers became essential to agriculture, railroads, construction, manufacturing, and services. Later migrations from the Caribbean, Latin America, Asia, Africa, and the Middle East reshaped both countries.
Every wave was made to seem permanently foreign by somebody who had arrived earlier.
Interactive: Migration Is Not One Arrow
Choose a migration system. The moving lines are schematic rather than quantitative. They show broad directions and destinations, not every route. Notice that the international border does very little to explain the whole story.

Migration changes with law, labor demand, family networks, conflict, education, and global inequality. Canada uses an explicit system of permanent immigration, family reunification, temporary work, education, and refugee resettlement. In the 2021 census, immigrants accounted for 23 percent of Canada's population, the country's largest share in more than 150 years. Recent immigrants accounted for 71.1 percent of population growth in private households between 2016 and 2021.
The early 2020s then demonstrated how quickly policy can alter geography. Canada's population declined in the third and fourth quarters of 2025 and again in the first quarter of 2026 as the number of non-permanent residents fell. Statistics Canada estimated 41.42 million people on April 1, 2026, including about 2.56 million non-permanent residents, down from a peak of about 3.15 million in October 2024. In the United States, the Census Bureau estimated that net international migration fell from 2.7 million in the 2024 estimates year to 1.3 million in 2025. Its January 2026 projection suggested roughly 321,000 by July 2026 if those trends continued; that final number was explicitly a projection, not yet an observed annual estimate.
National totals are only the beginning. Migration reorganizes specific places: a meatpacking town on the Great Plains, a Toronto suburb, a Somali commercial district in Minneapolis, a Filipino community in Winnipeg, a Haitian neighborhood in Montreal, or a technology corridor in California. Households make distant places part of the same social geography.

This is why the language of assimilation can sometimes obscure more than it explains. Migrants do change. So do the places receiving them. Foods, businesses, schools, religious institutions, music, political coalitions, and neighborhood identities change as people arrive and as their children grow up.
A family can become Minnesotan, Canadian, Somali, Muslim, American, French-speaking, Black, Indigenous, or several of those things at once. Identity does not operate like a border checkpoint where one category must be surrendered before another is permitted.
Race Is a Category and a Landscape
Race is not a biological division of humanity. It is a social and political classification whose consequences become material through institutions.
The categories themselves change. U.S. census forms distinguish race from Hispanic or Latino origin. Canada uses different concepts, including population groups and Indigenous identity. People may choose more than one identity, reject official labels, or understand the same word differently across generations. The U.S. population identifying with two or more races increased dramatically between 2010 and 2020, partly because identities changed and partly because census methods improved.
Categories matter because institutions have acted through them. Enslavement, citizenship, immigration quotas, property restrictions, school segregation, voting rules, policing, and lending practices have all used racial classification directly or indirectly.
The resulting geography can remain after the wording changes. A formerly segregated neighborhood can retain lower property values and less accumulated family wealth. A reservation can preserve the shape of a treaty negotiated under coercion. A suburb can appear formally open to everyone while housing prices and zoning reproduce older inequalities.
English Is Dominant, Not Alone
English is the dominant language of both countries, but North America is profoundly multilingual. Canada recognizes English and French as official languages at the federal level. Quebec has a French-speaking majority and laws intended to maintain French public life within an overwhelmingly English-speaking continent. New Brunswick is officially bilingual.
Montreal is a French-speaking metropolis whose daily life also includes English, Arabic, Haitian Creole, Spanish, Mandarin, and many other languages. French in Canada is not simply an immigrant language. It is connected to conquest, settlement, education, political institutions, and national identity. Quebec nationalism grew partly from the effort to transform French Canadians from a subordinate cultural population into a modern political nation. The 1995 sovereignty referendum failed by less than one percentage point.
Spanish is by far the most widely spoken non-English language in the United States. Chinese languages, Tagalog, Vietnamese, Arabic, French, Korean, Russian, and hundreds of others shape schools, businesses, media, and neighborhoods. In the 2018-2022 American Community Survey, more than one-fifth of Americans age five and older spoke a language other than English at home. About 61 percent of that population spoke Spanish.
Indigenous languages require a different frame. Their decline was not an ordinary market outcome. Governments and schools deliberately suppressed them. Revitalization through immersion schools, community media, ceremonies, digital tools, and official recognition is therefore cultural renewal and political survival.
Religion, Secularization, and Regional Culture
Christianity shaped institutions, holidays, architecture, politics, and settlement throughout both countries. Protestant traditions became especially influential in the United States, while Catholicism strongly shaped Quebec, other parts of Canada, Indigenous missions, and many immigrant communities.
The contemporary pattern is far more varied. The United States remains more publicly religious than many wealthy democracies, but religious affiliation has declined and regional differences are substantial. Evangelical Protestantism is especially influential in parts of the South and interior. Catholic communities reflect long histories as well as newer migration from Latin America, the Philippines, and elsewhere. Jewish, Muslim, Hindu, Buddhist, Sikh, and other communities have created institutions throughout metropolitan North America.
Canada has secularized rapidly, particularly in Quebec after the Quiet Revolution, while immigration has increased religious diversity. The 2021 Canadian census recorded responses across more than 200 religious traditions and denominations as the share reporting no religion also continued to grow.
A Sikh gurdwara in suburban Toronto is simultaneously a place of worship, community center, migration network, and neighborhood landmark.
A former Catholic institution in Quebec may remain architecturally dominant even after the society surrounding it becomes much less religious.
Mosques, temples, churches, cemeteries, schools, and festivals create cultural landscapes that connect neighborhoods to distant homelands.
Ceremony at a reclaimed or protected place can restore relationships that older maps and policies attempted to erase.
Food Is a Migration Archive
The North American meal is sometimes described as though it were nationally pure: hamburgers, barbecue, poutine, apple pie, Thanksgiving turkey. Look closer and the plate becomes an archive of movement.
Wheat, beef, dairy, potatoes, tomatoes, maize, chiles, sugar, coffee, and spices entered these cuisines through different ecological, Indigenous, colonial, and migration histories. Indigenous peoples domesticated maize, beans, squash, and many other foods long before European arrival. Enslaved Africans carried agricultural knowledge and culinary traditions. Immigrants adapted recipes to local ingredients, new markets, and remembered tastes.
The result is not a smooth melting pot. Food can preserve difference while also crossing boundaries. Montreal bagels and smoked meat preserve Jewish urban history. Barbecue styles map regional arguments across the United States. Wild rice remains culturally and legally significant to Anishinaabe peoples, for whom manoomin is not simply a fashionable grain.
Caribbean, Mexican, Vietnamese, Somali, Hmong, Ethiopian, Punjabi, Lebanese, and many other foodways have transformed cities and suburbs. This is especially easy to see in the Twin Cities, where migration that may look distant on a world map becomes visible in markets, restaurants, gardens, groceries, festivals, and ordinary family meals.
A Scandinavian festival in a northern plains town may celebrate genuine family history. It can also create the impression that the region's authentic culture belongs principally to a European settler past. Walk into a nearby market and the contemporary cultural landscape becomes much harder to simplify.

Population Gathers Unevenly
Population geography also has a vertical dimension: age. The United States and Canada are both aging societies, but their shapes differ enough to matter for labor markets, schools, health systems, housing, and immigration policy.
Population structure: United States and Canada, 2025
Use the same instrument used elsewhere in the book: male on the left, female on the right, older ages at the top, younger ages at the bottom. Both countries use the same age bands and scale so the shapes can be compared directly.
UN World Population Prospects 2024 estimate: about 347.3 million
UN World Population Prospects 2024 estimate: about 40.1 million
The population of the United States and Canada is concentrated in metropolitan regions, coastal corridors, the Great Lakes, and a relatively narrow southern Canadian belt near the U.S. border. Large northern and interior spaces can dominate the visual map while containing comparatively few people.
This does not make rural geography unimportant. Rural regions produce food, timber, energy, minerals, recreation, and ecological services. They contain tribal lands, small towns, prisons, factories, retirement communities, tourist landscapes, and immense areas of public land. What has changed is their relationship to metropolitan systems.
Some rural counties become commuter zones or amenity destinations. Others lose young adults and struggle to maintain hospitals, schools, transit, and businesses. Remote work can bring residents to selected scenic or well-connected places, but broadband access and housing costs shape who can benefit.
Canada presents an especially striking contrast between territory and population. Most people live in metropolitan regions in the southern part of the country. Toronto, Montreal, Vancouver, Calgary, Edmonton, Ottawa-Gatineau, and other metropolitan areas organize enormous labor, housing, immigration, and transportation networks that extend far beyond their downtown skylines.
Identity Is Not a Census Checkbox
National identity is often strongest when it feels least visible. Americans may describe themselves through freedom, constitutional rights, individualism, military service, race, religion, immigration, or regional belonging. Canadians may emphasize public health care, parliamentary government, bilingualism, multiculturalism, hockey, social restraint, or simply being unlike the United States.
None of these identities is necessarily false, but all are selective. The United States contains strong public institutions alongside individualism. Canada contains deep regional conflict alongside an international reputation for moderation. Both countries contain people who experience the national story as promise, people who experience it as exclusion, and many who experience both.
Regional identities make the picture still more complicated. Quebec is a French-speaking nation within Canada. Newfoundland joined Confederation only in 1949. Alberta politics often express western alienation. The U.S. South, New England, Appalachia, Texas, Hawaii, Puerto Rico, the Great Lakes, and the Pacific Coast each possess distinct historical imaginations.
What to carry forward
- Indigenous nations are contemporary governments and communities. State and provincial maps do not replace Indigenous sovereignty, treaty rights, or continuing political relationships.
- Settler colonialism reorganized land through settlement, treaties, removal, allotment, schools, property law, infrastructure, and state power; its spatial consequences remain visible.
- North American population geography was built through many kinds of movement, including forced Atlantic migration, European settlement, the Great Migration, and continuing migration from Latin America, Asia, Africa, the Caribbean, and elsewhere.
- Race is socially constructed but geographically consequential because laws, markets, institutions, and discrimination have made categories durable in neighborhoods, property, wealth, schools, and political power.
- Language, religion, food, and regional identity reveal overlapping cultural geographies rather than a single national culture.
- The United States and Canada are both aging, metropolitan societies. Immigration policy can alter population growth and age structure surprisingly quickly.
Vocabulary for the section
Works cited and data sources
- Fouberg, Erin H., and William G. Moseley. Understanding World Regional Geography, 2nd ed. Wiley, 2018.
- U.S. Bureau of Indian Affairs. Tribal Leaders Directory. The directory listed 575 federally recognized tribes as of January 30, 2026.
- Crown-Indigenous Relations and Northern Affairs Canada. Modern Treaties and 2025-26 departmental implementation materials.
- Statistics Canada. 2021 Census immigration release: immigrants were 23.0 percent of Canada's population, and recent immigrants accounted for 71.1 percent of 2016-2021 private-household population growth.
- Statistics Canada. Population estimates, first quarter 2026.
- U.S. Census Bureau. U.S. Population Growth Slows Due to Historic Decline in Net International Migration, 2026.
- United Nations Department of Economic and Social Affairs, Population Division. World Population Prospects 2024.
- Library of Congress / Bureau of Ethnology. John Wesley Powell, Map of Linguistic Stocks of American Indians, 1890. Used here as historical evidence, not as a present-day sovereignty map.
Further reading
- Truth and Reconciliation Commission of Canada. Calls to Action.
- Wilkerson, Isabel. The Warmth of Other Suns: The Epic Story of America's Great Migration.
- Treuer, David. The Heartbeat of Wounded Knee: Native America from 1890 to the Present.
The next section moves from people and identity into the built system itself: ports, railroads, streetcars, mortgages, highways, zoning, segregation, suburbs, downtowns, and the accumulated decisions that made the modern North American metropolis.


Comments
Post a Comment